Cart Bag vs Stand Bag: Complete Decision Framework 2025
A detailed comparison of cart bags and stand bags — walking vs riding, storage, weight, and price.
Executive Summary
Use this article as a reference you can share internally — with procurement, product, and operations — to align decisions and reduce avoidable mistakes.
This page is designed to be scannable and actionable: tables, checklists, and short sections that answer the questions buyers actually ask.
Understanding the Fundamental Differences
The choice between cart bags and stand bags is one of the most consequential product decisions for golf brands. These two categories serve fundamentally different use cases, and understanding the engineering, market positioning, and pricing dynamics of each is essential for any serious golf bag procurement strategy.
Structural Engineering Differences
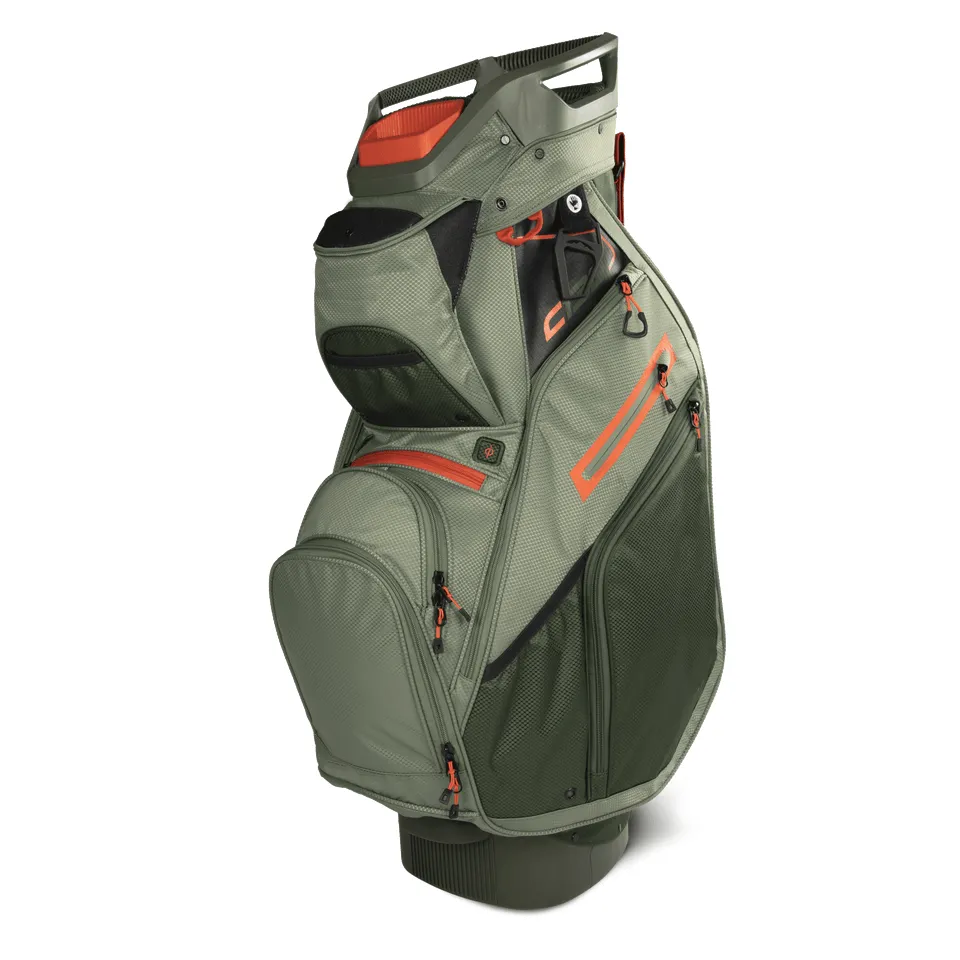
Cart bags are engineered for stability and organized storage on golf carts and electric trolleys. They feature rigid tops (typically 8-10 inches in diameter) with 14-way or full-length dividers that prevent club overlap and tangling during cart transport. The structural design assumes the bag will remain stationary during play, which means no stand legs, reduced padding in the base, and optimized weight distribution for cart mounting rather than carrying comfort.
Stand bags, by contrast, are designed for human transport. The integrated leg mechanism (typically aluminum alloy with spring-loaded deployment) must support the bag at an angle that keeps club heads off the ground. This requires reinforced base construction, ergonomic shoulder straps, balanced weight distribution for hip clearance, and careful consideration of the bag's center of gravity when loaded with clubs.
2025 Market Data and Pricing
The cart bag market is valued at approximately $420 million globally, with an average selling price of $145 for OEM-produced custom bags. Stand bags command an ASP of $125 but show stronger growth (5.2% CAGR vs 3.1% for cart bags), driven by the increasing popularity of walking golf and push carts. For brands building product lines, the stand bag category offers better growth trajectory and wider consumer appeal, while cart bags provide more stable, predictable demand from serious golfers.
Performance Comparison Table
| Dimension | Cart Bag | Stand Bag |
|---|---|---|
| Average Weight | 7-9 lbs | 4.5-6.5 lbs |
| Divider System | 14-way full-length | 4-5 way (partial) |
| Pocket Count | 9-12 | 6-9 |
| Cart Stability | ★★★★★ | ★★★☆☆ |
| Walking Comfort | ★★☆☆☆ | ★★★★☆ |
| Club Protection | ★★★★★ | ★★★☆☆ |
| Storage Volume | High | Moderate |
| OEM Price Range (FOB) | $45-95 | $35-75 |
Target Market Analysis
Cart bag buyers tend to be older (median age 52), ride in carts (85%+ of rounds), play frequently (50+ rounds/year), and prioritize organization and club protection. Stand bag buyers skew younger (median age 44), prefer walking or push carts (60%+ of rounds), and value light weight and versatility. For brands entering the market, stand bags offer broader initial appeal, while cart bags provide stickier customer relationships once golfers commit to the cart-lifestyle segment.
Hybrid Products: A Growing Category
2025 has seen significant growth in hybrid bags that attempt to serve both use cases. These bags feature removable stand legs, cart-optimized base plates, and 8-9 inch tops that work on carts while remaining carryable. For OEM buyers, hybrids offer 15-25% higher price points but require more complex quality control, as the removable leg mechanism is a common failure point. If pursuing the hybrid segment, ensure factories have specific experience with this construction type.
Key Takeaways
- Cart bags favor organization and protection for cart users; stand bags favor walking comfort
- Stand bags show stronger growth trajectory in 2025 market data
- Hybrid bags represent a high-growth opportunity with elevated quality requirements
- Match your factory selection to the specific bag type's engineering demands
Timeline Planning (Sampling → Production → Shipping)
Most buyers underestimate the approval cycle. This timeline helps you plan backwards from your launch date.
| Stage | Typical Duration | What You Approve |
|---|---|---|
| Tech pack + render | 3–7 days | Dimensions, layout, logo placements |
| Prototype sample | 10–20 days | Structure and pocket usability |
| Pre-production sample | 10–15 days | Materials, colors, branding finish |
| Mass production | 25–45 days | QC plan and photo checkpoints |
| Shipping | 7–45 days | Incoterms, destination requirements |
Quality & Testing Checklist (Buyer-Friendly)
Use this checklist to align factory QC with your brand standards. It reduces disputes and prevents “sample vs bulk” gaps.
| Area | What to Check | Practical Acceptance Criteria |
|---|---|---|
| Stitching | Seams, stress points, bartacks | No loose threads; reinforced points on straps and pocket corners |
| Zippers | Slider smoothness, tape alignment | Opens smoothly under load; no zipper waves |
| Stand mechanism | Deploy/retract consistency | Deploys cleanly; stable angle; no binding noise |
| Top & dividers | Club insertion, divider stability | No collapse; clean edges; consistent spacing |
| Branding | Logo placement and size | Matches approved placement map |
Common Mistakes (And How to Avoid Them)
- Vague descriptions: Replace “bag” with material + intended use + construction notes.
- Late approvals: Approve key items early (materials/colors/labels) to prevent schedule slips.
- No verification: Ask for photos, test notes, and documented checkpoints before shipment.
FAQ
Q: What information should I prepare before requesting a quote?
A: Bag type, quantity, target market, target price range, branding method, and timeline.
Q: What reduces back-and-forth the most?
A: One clear brief with reference photos and written requirements.
Next Step
If you want a fast, accurate quote, send your bag type, quantity, and destination requirements to cco@junyuanbags.com (WhatsApp: +8617750020688).
.webp)
.webp)